Chart2SVG: Editable SVG Generation from Raster Chart Images
Jinning Cui, Lu Chen, Haoyan Shi, Yue He, Chenglong Wang, Mengyu Zhou, Weidong Huang, Yunhai Wang
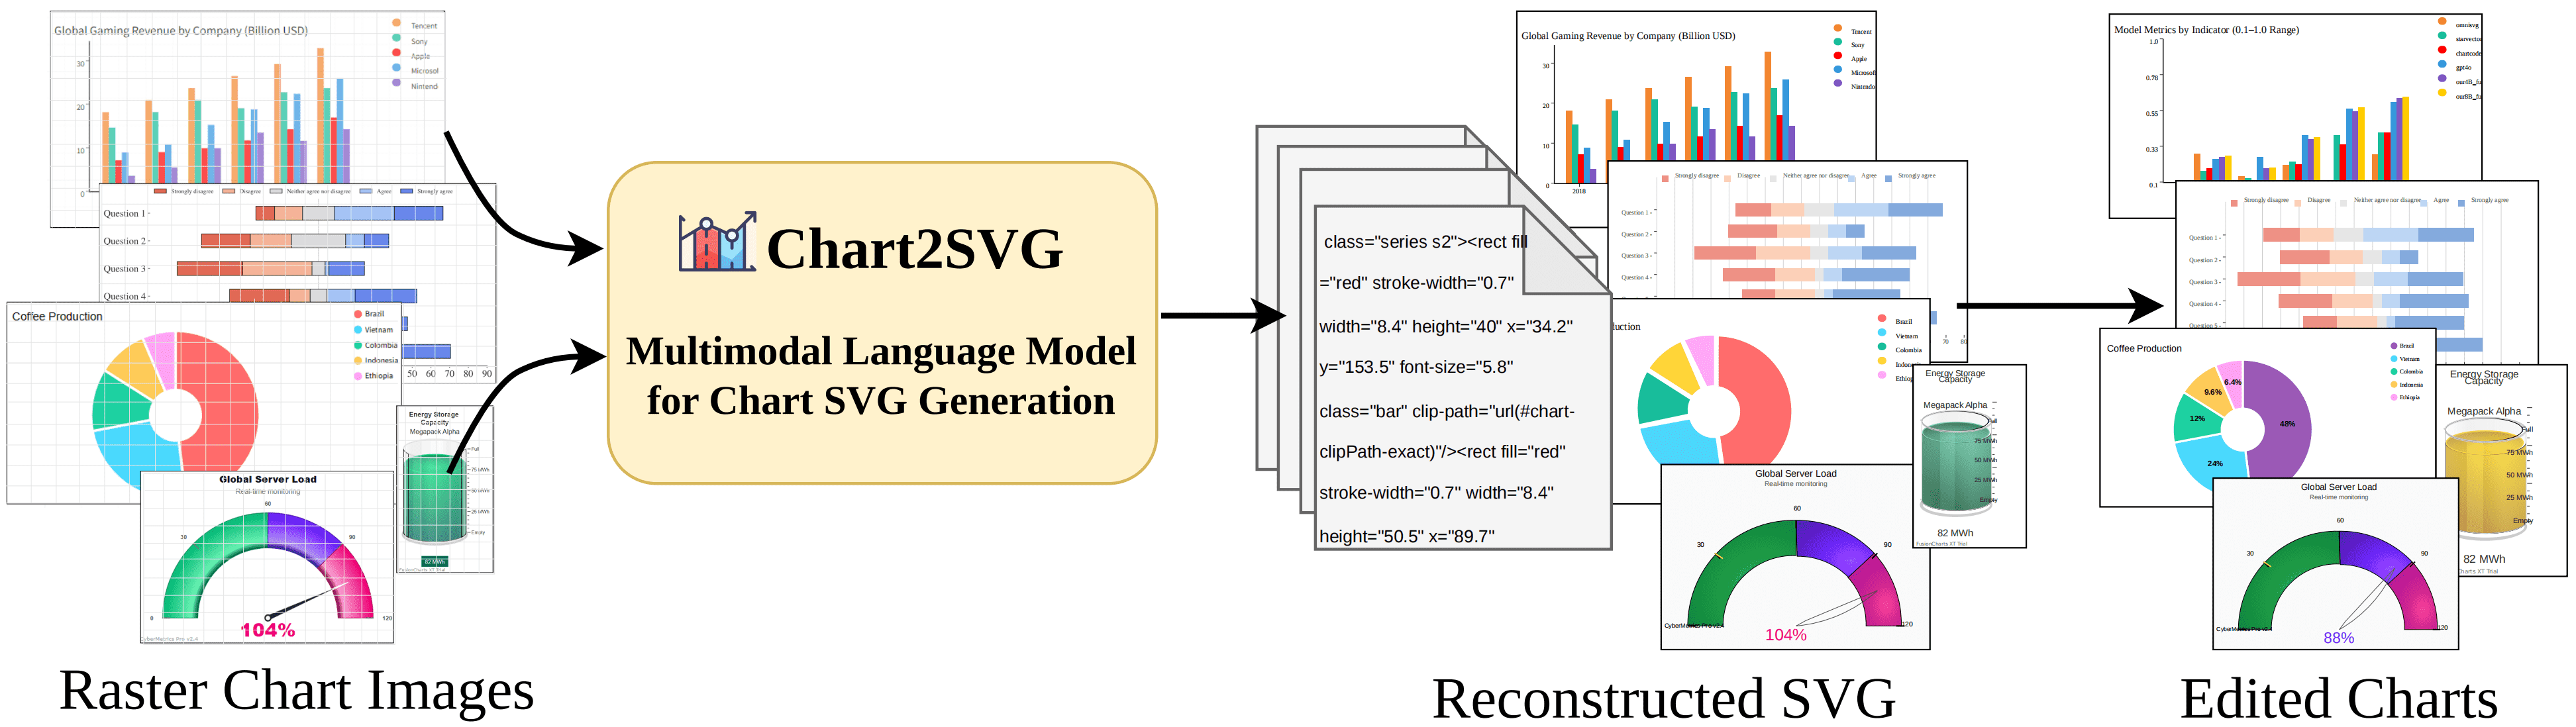
Figure 1: Raster inputs, model, and editable vector outputs.
Abstract (Summary)
Chart2SVG reconstructs editable vector charts from raster inputs. Its vision-language model learns chart elements and their roles using the Beagle+ training collection. Training also evaluates rendered results to improve the appearance and organization of generated SVGs. A graph representation records relationships among chart components, allowing subsequent operations to preserve those relationships. The project demonstrates retrieving values, selecting marks, changing scales, transforming chart types, and adapting an existing layout to another dataset.
Links
Figures
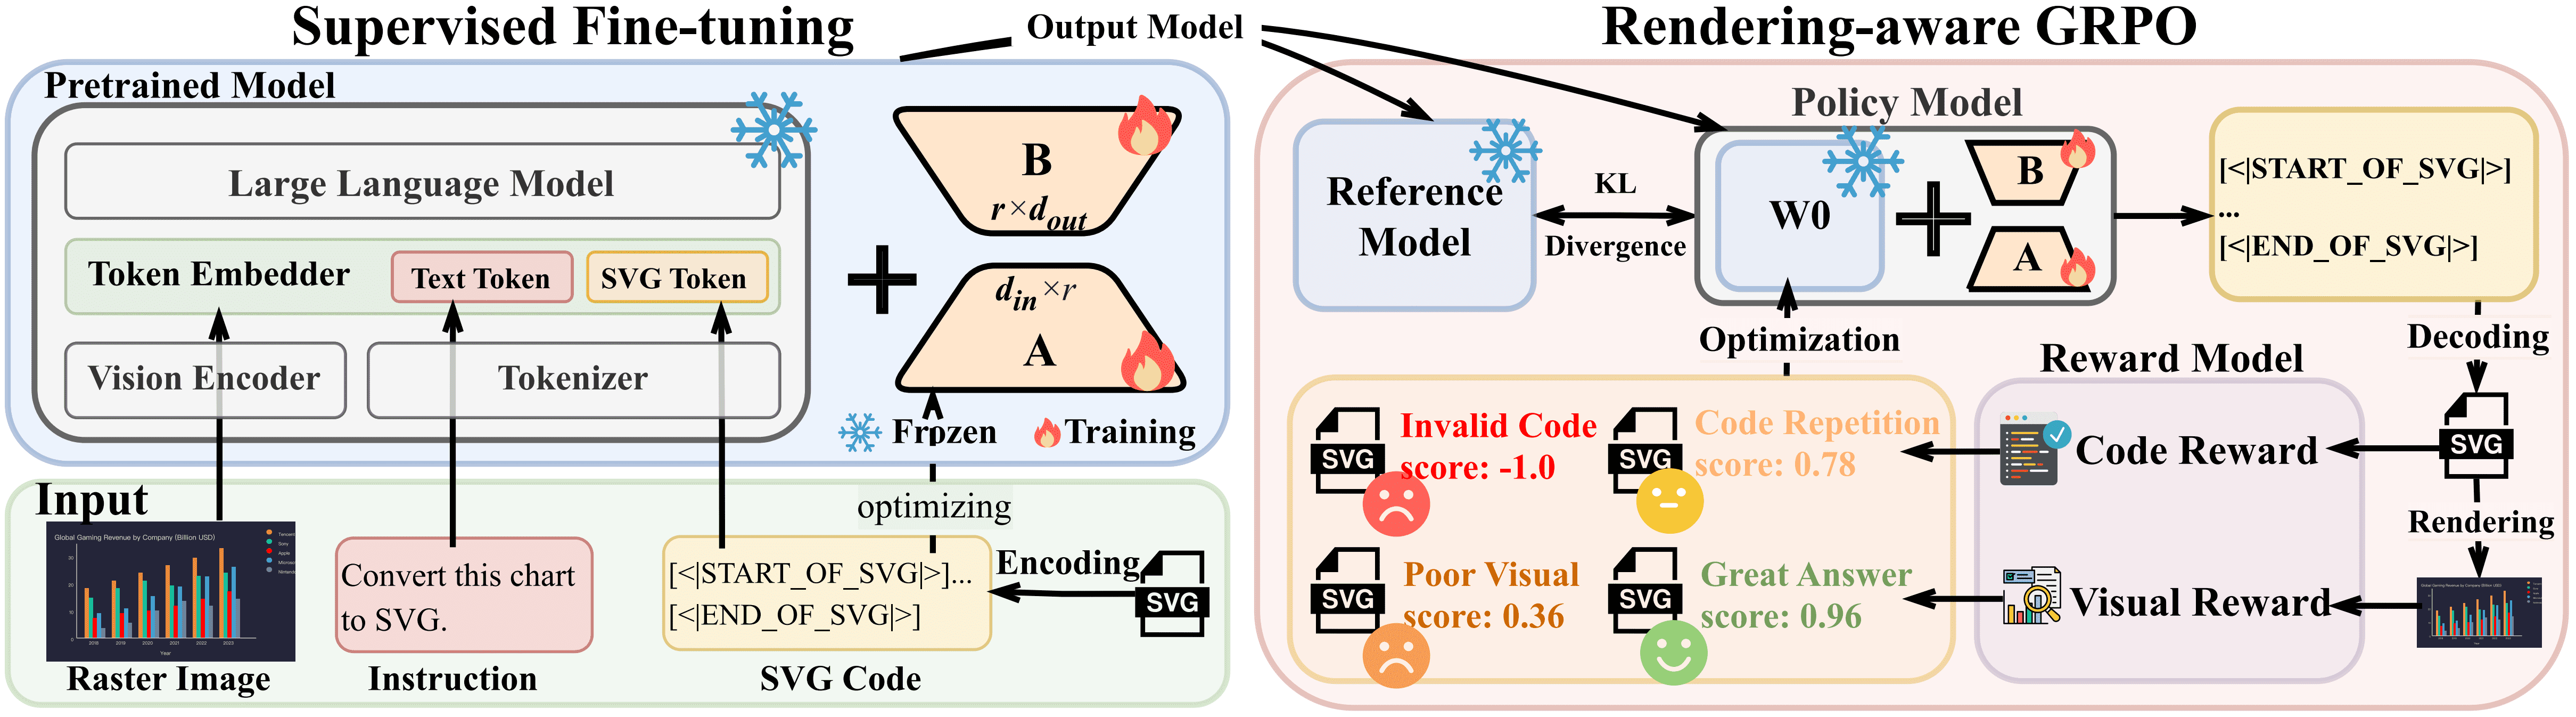
Figure 2: Model training and rendering-based optimization.
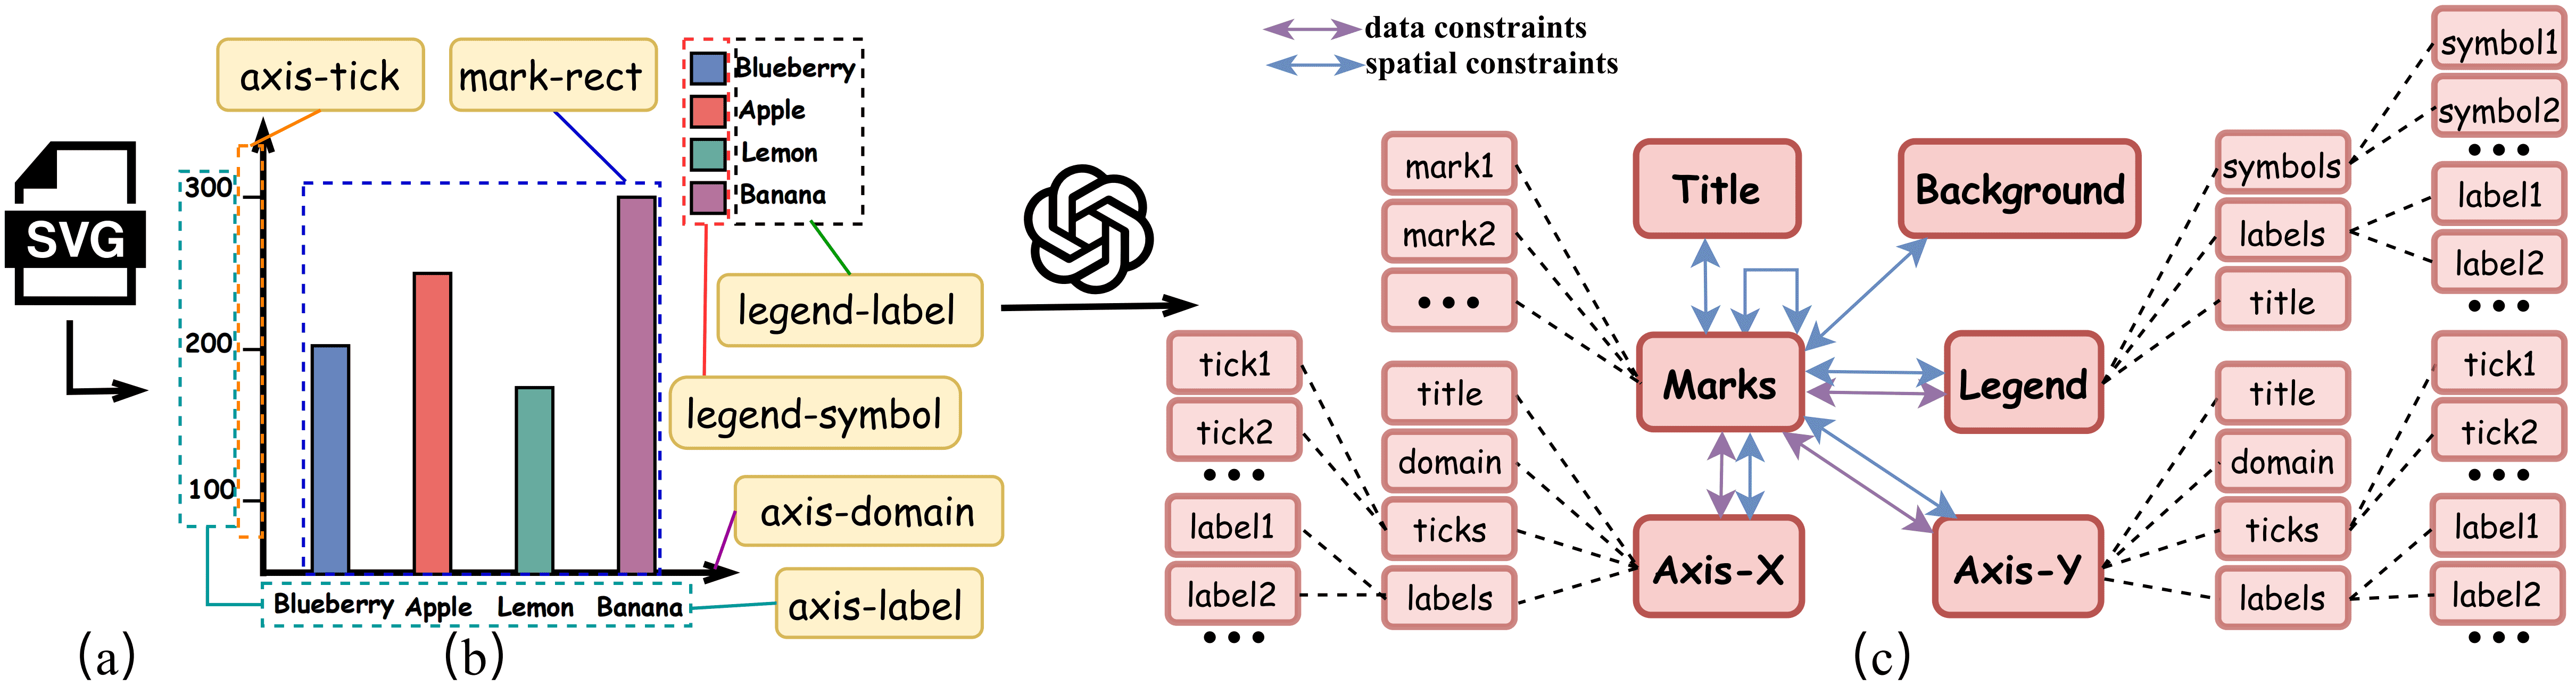
Figure 3: Recovering relationships among chart elements.
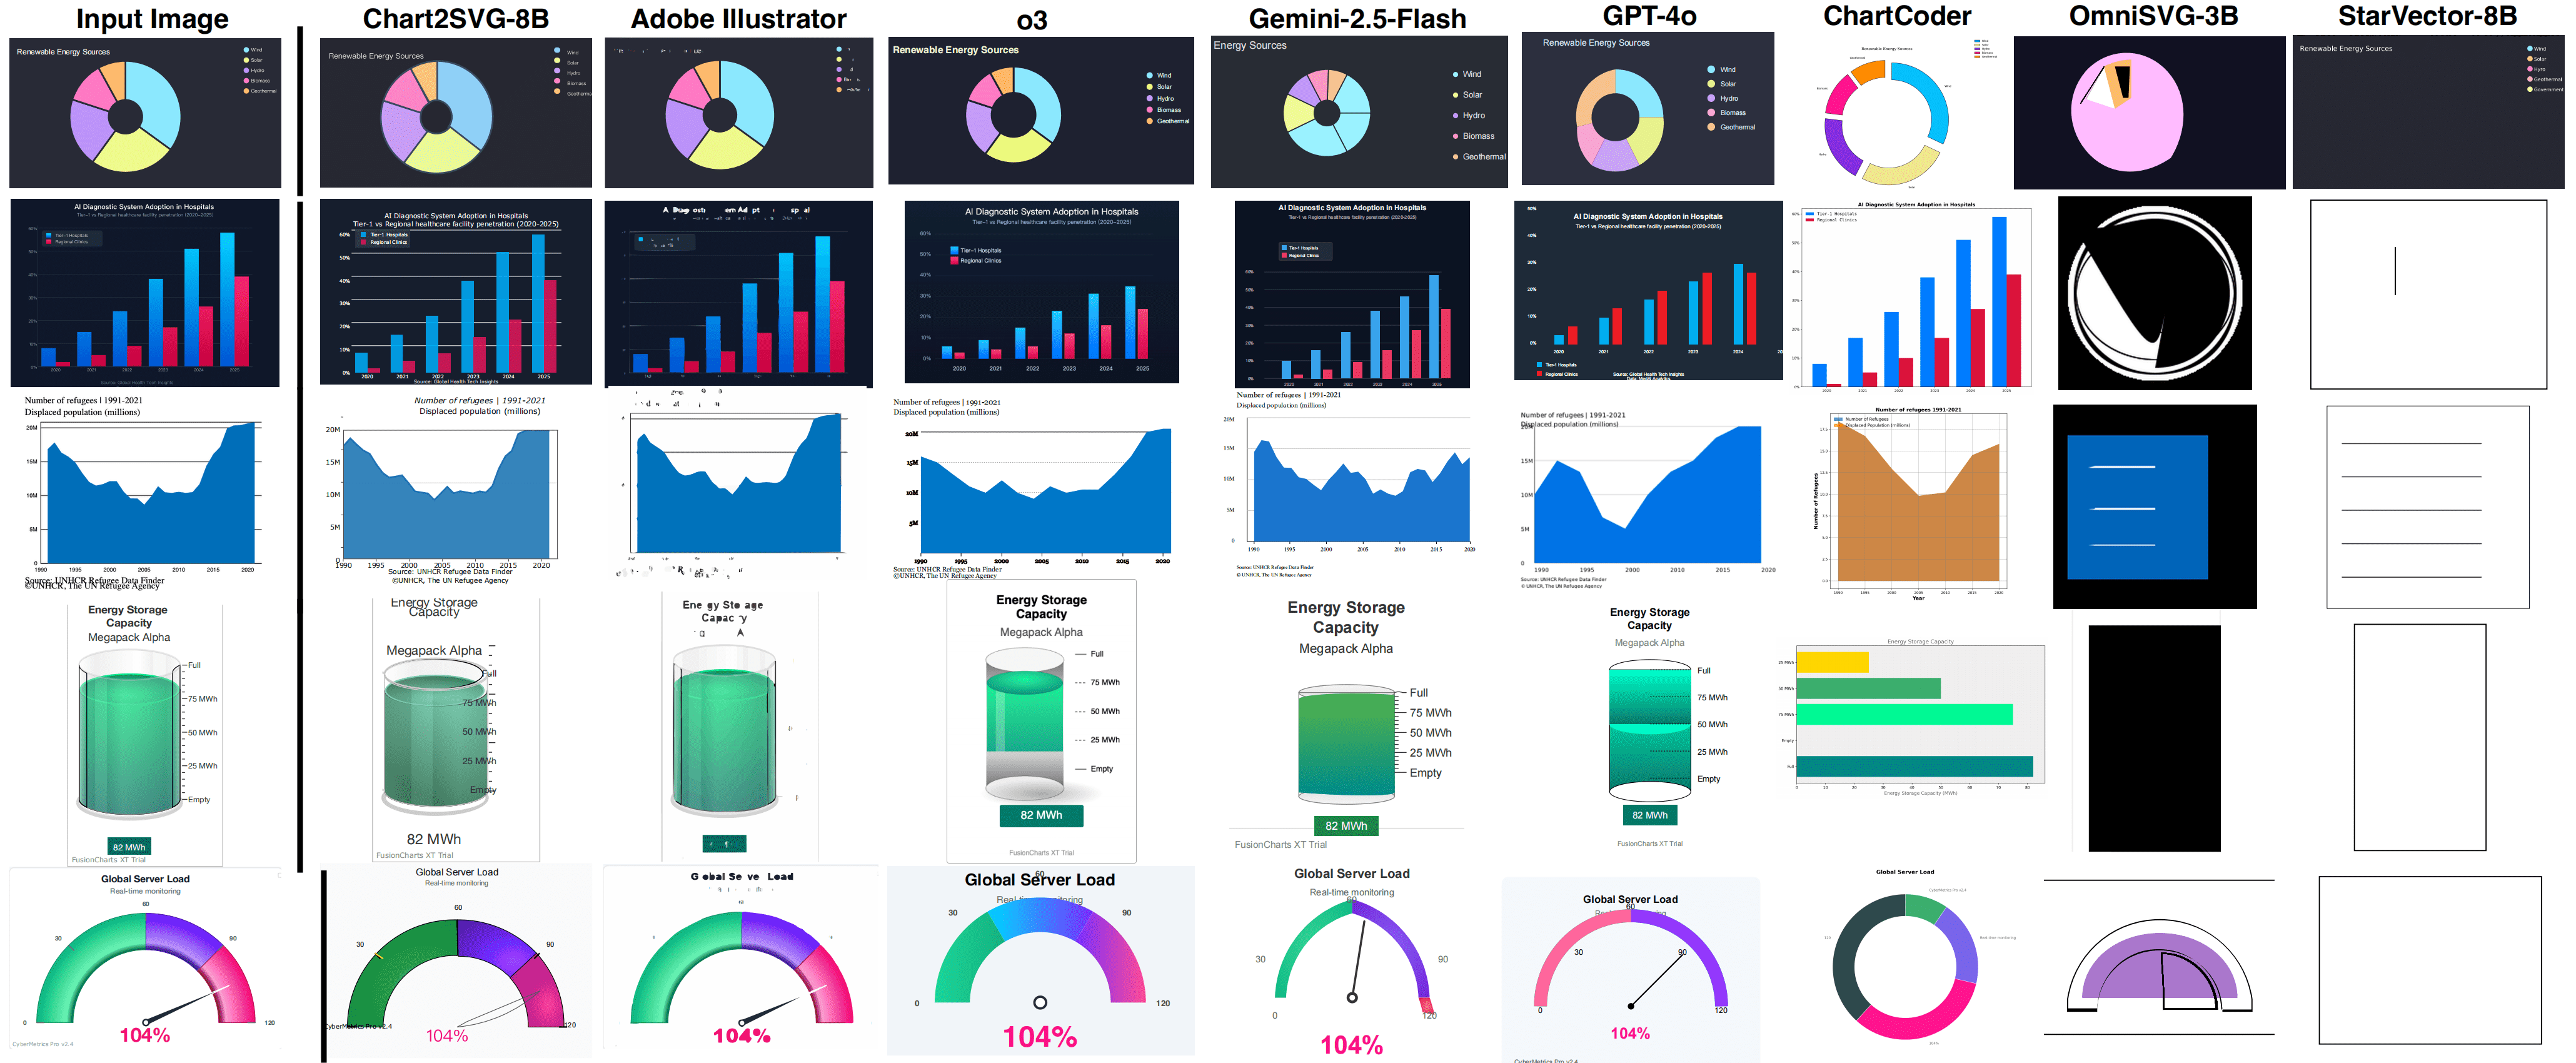
Figure 4: Visual reconstruction across competing models.
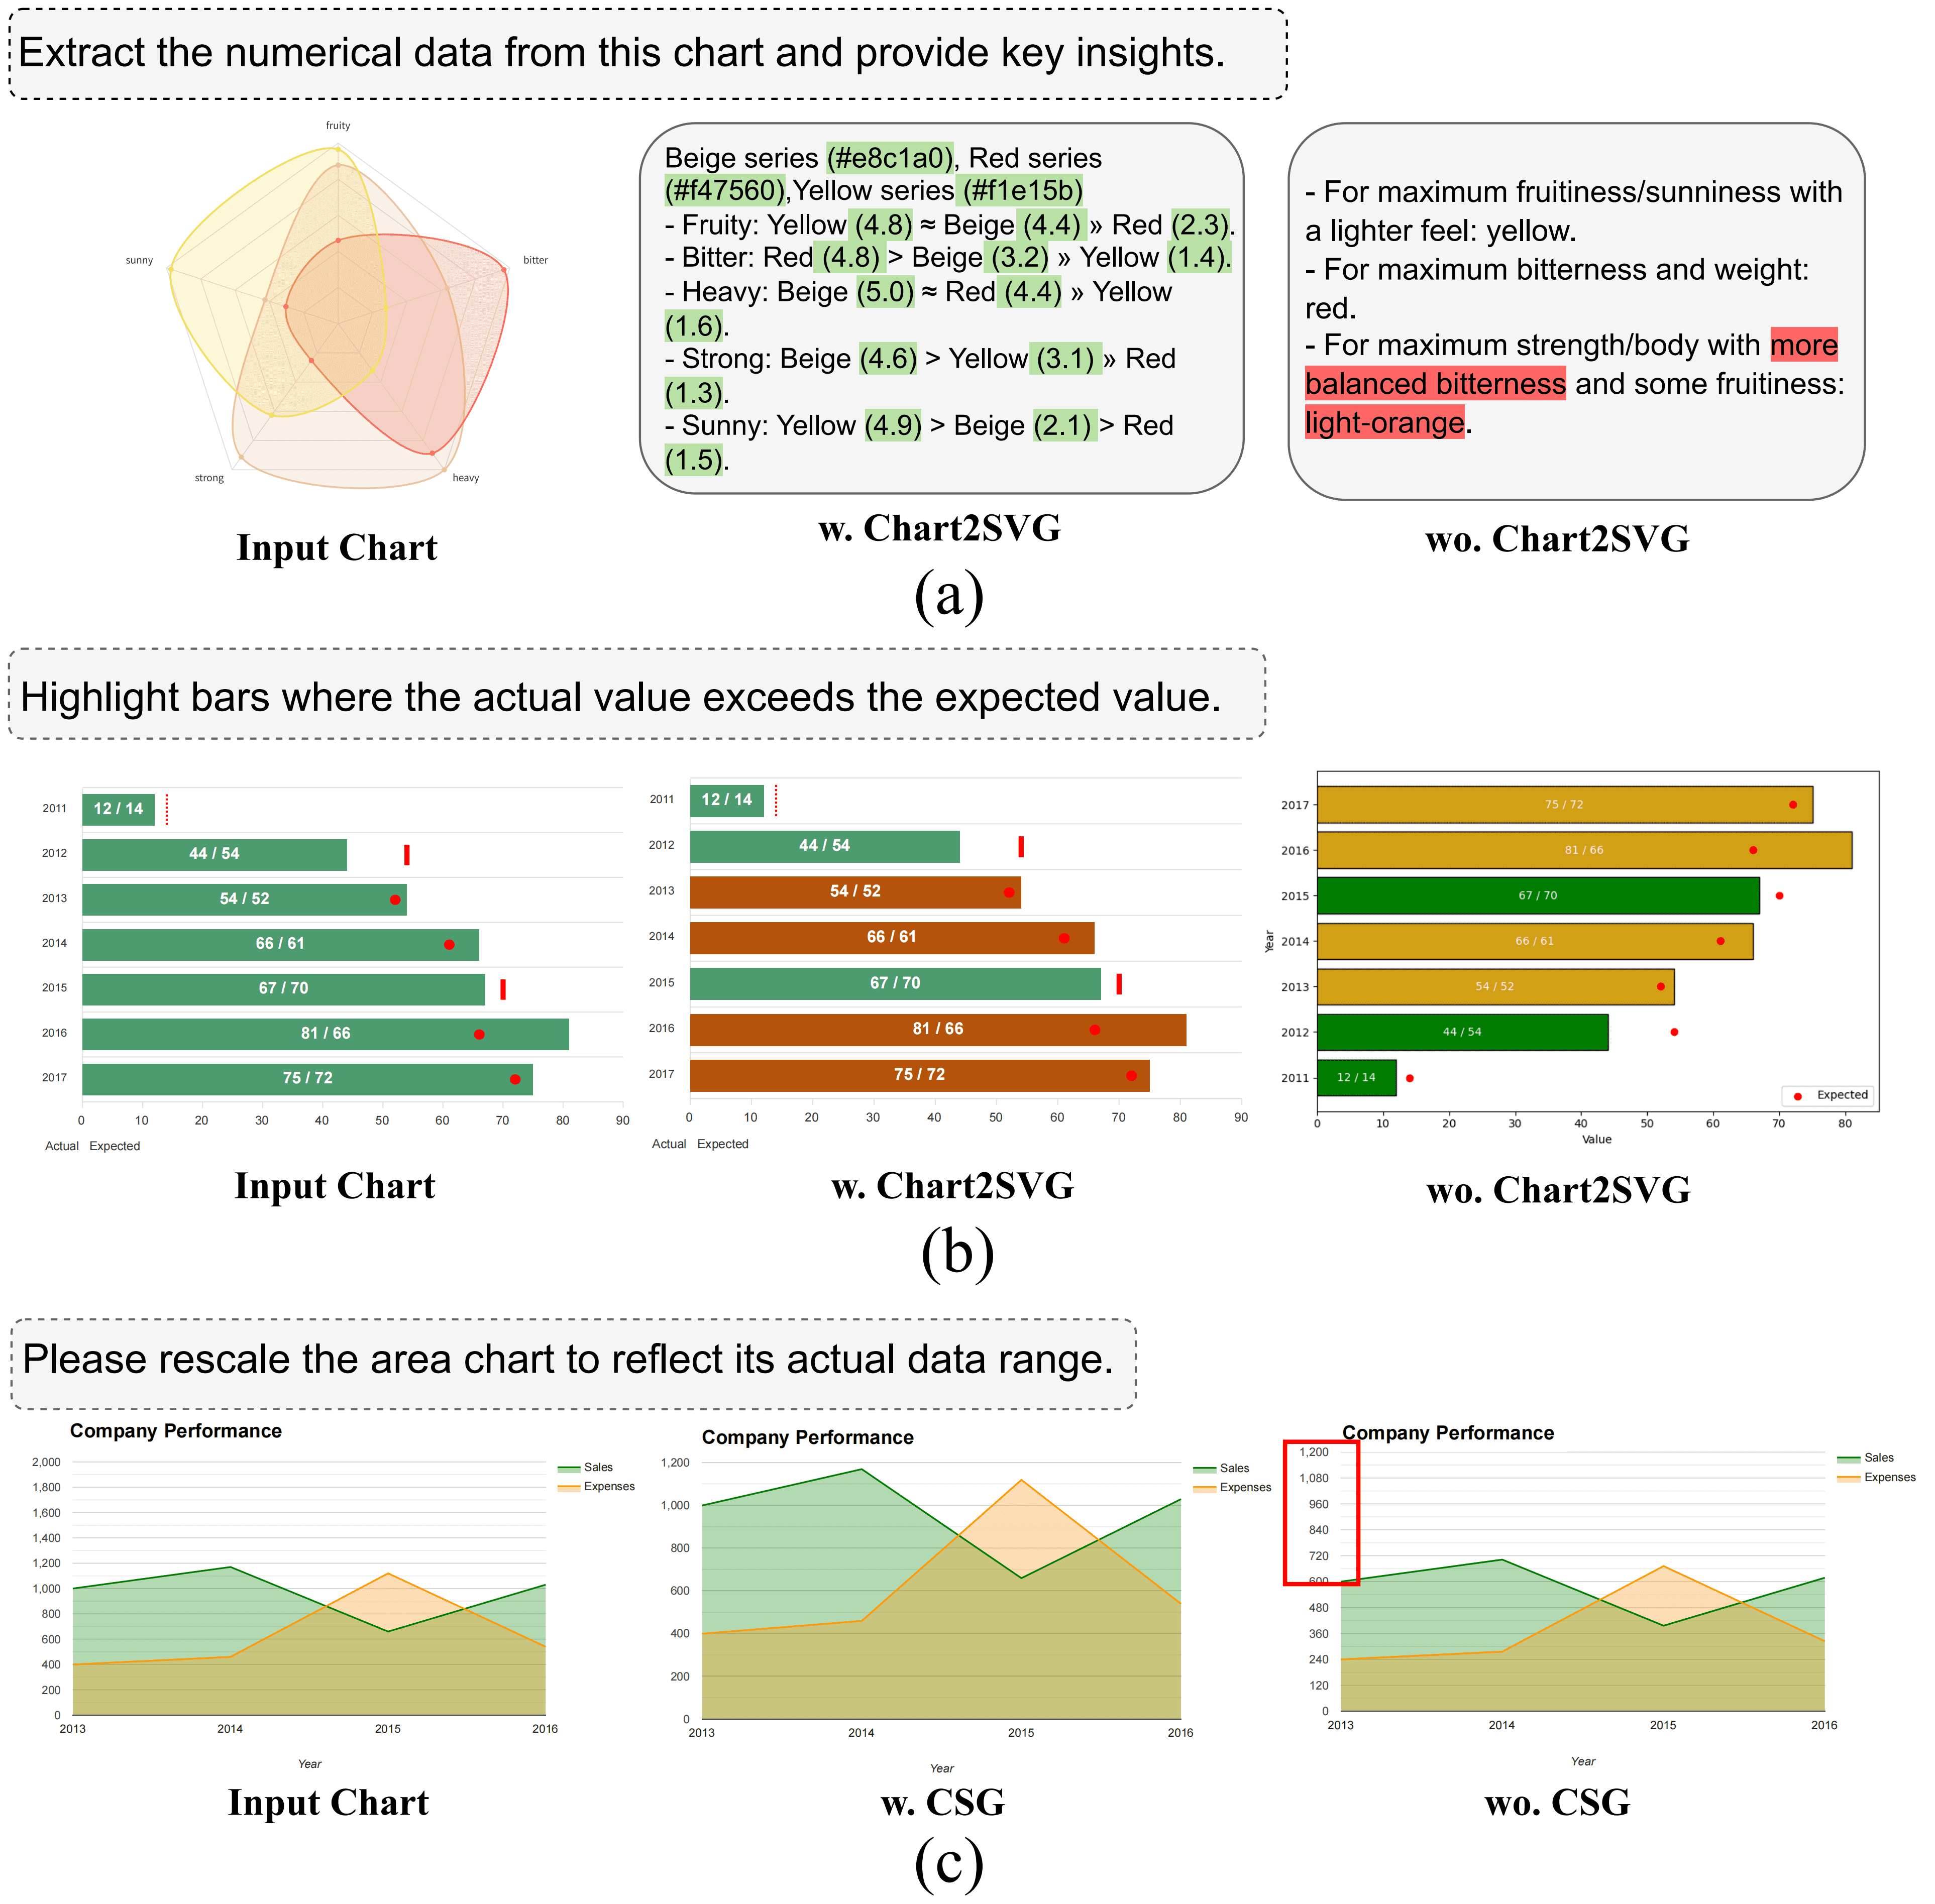
Figure 5: Retrieving values and modifying chart elements.
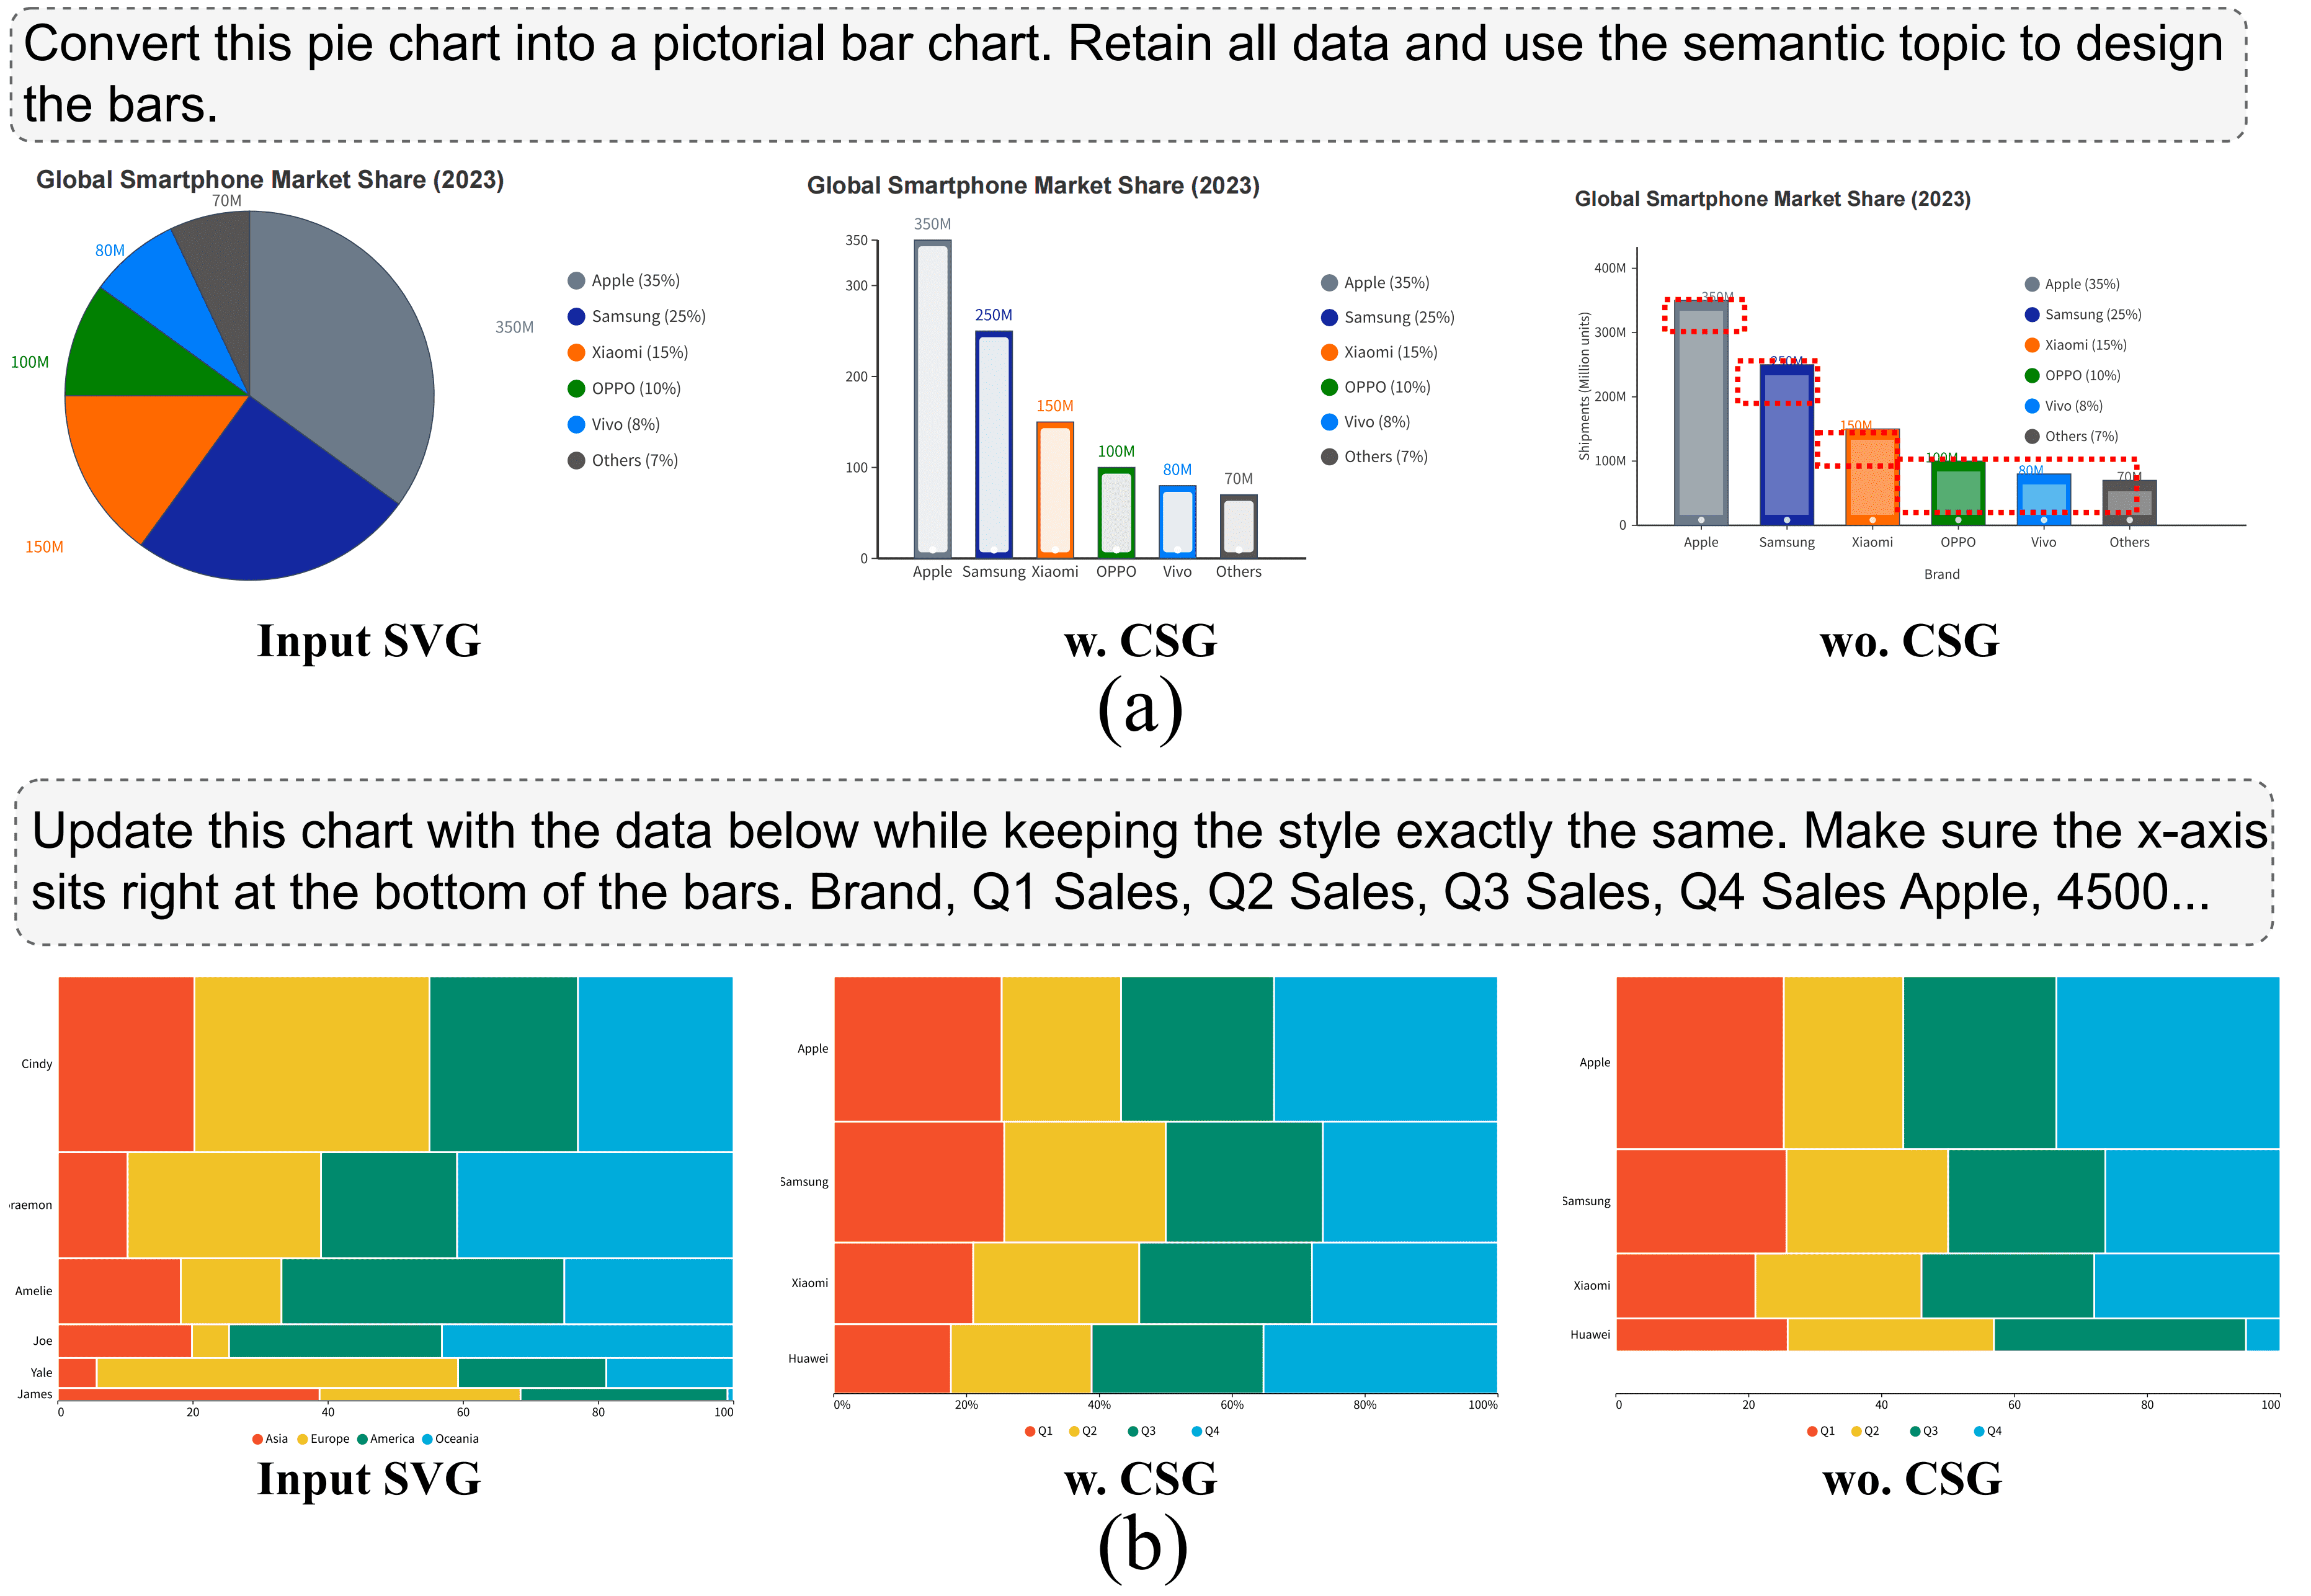
Figure 6: Changing chart types and reusing layouts.